港股新股首日升幅预测:一个简单的机器学习项目
代码在 https://github.com/crownpku/hk_ipo_prediction
香港股市常年位于全球新股集资三甲之列,每年都有上百只新股上市。与已上市的正股相比,新股的特点是没有任何历史交易数据,这使新股的feature比较朴素,使其可以变成一个较为简单的机器学习问题。
我们在这里,以练手为目的,用新股首日升幅的预测作为例子,介绍一个比较完整的机器学习流程。
所有的代码开源在github上,请点击[这里].
数据获取
一个机器学习的项目,最重要的是数据。没有数据,一切再高级的算法都只是纸上谈兵。
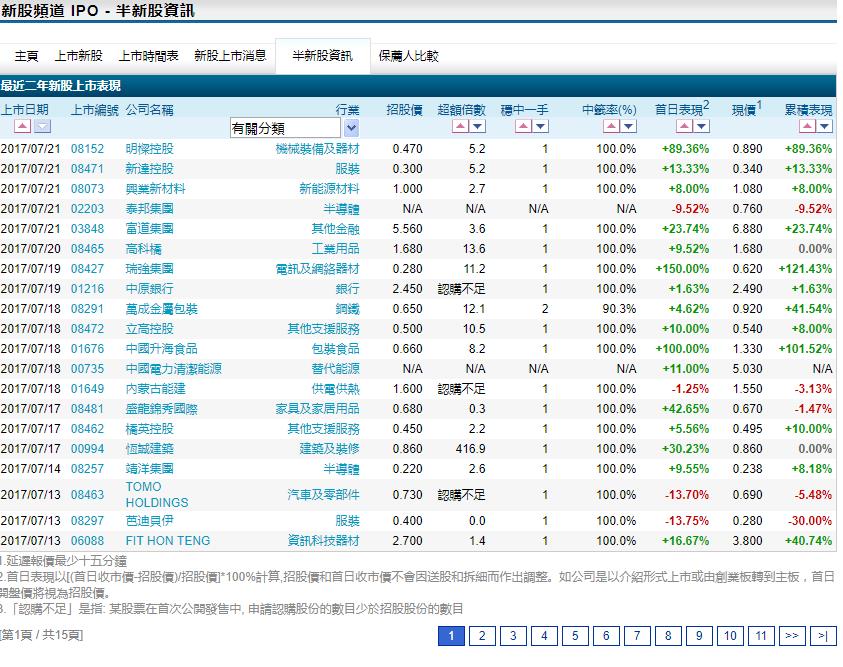
香港新股的数据可以比较容易从一些网站上获取,且这些网站基本没有任何反爬虫措施。我们的新股数据,就准备从aastock的新股频道上面获取。
aastocks很贴心的已经为我们整理好了一个分页表格,让我们可以很容易地爬取到新股的上市日期、上市編號、公司名稱、行業、招股價、超額倍數、穩中一手、中籤率(%)、首日表現、現價和累積表現。这些稍后都会作为我们的feature。
我们使用selenium和phantomjs的组合,爬虫函数如下:
def get_sotcks_info(ds, outfile):
    stocks = ds.find_elements_by_xpath('//tr[@class="DR" or @class="ADR"]')
    for stock in stocks:
        strtmp = ''
        for element in stock.find_elements_by_xpath('.//td'):
            strtmp += '\t' + element.text.strip('"').strip()
        print strtmp
        print >> outfile, strtmp.strip().encode('utf-8')
    return 0
每只股票还有更多的信息在个股页面里,如保荐人,包销商等,也是非常重要的数据。如中原银行 我们一并爬取:
def crawl_target_link(code, ds, target_link, outfile):
    fail_count = 0
    while fail_count <= 5:
        try:
            ds.get(target_link)
            values = ds.find_elements_by_xpath('//td[@class="defaulttitle"]/following-sibling::td')
            strtmp = str(code)
            for value in values:
                value = value.text.strip('"').strip().replace('\n', ' ').replace('\r', '')
                strtmp += '\t' + value
            print strtmp
            print >> outfile, strtmp.strip().encode('utf-8')
            return
        except Exception as e:
            print e
            print 'Try ' + str(fail_count+1) + ' Time'
            continue
如此我们有了data/ipo_list和data/ipo_details两个csv文件,存储了我们爬取的从2014年9月至2017年7月的所有新股相关数据。
数据清理和特征提取
接下来要做的是对数据进行清理,扔掉无关的项目,然后做一些特征提取和特征处理。
爬取的两个数据,我们先用pandas读取进来,用股票代码code做index,然后合并成为一个大的dataframe.
#Read two files and merge
df1 = pd.read_csv('../data/ipo_list', sep='\t', index_col='code')
df2 = pd.read_csv('../data/ipo_details', sep= '\t', index_col = 0)
#Use combine_first to avoid duplicate columns
df = df1.combine_first(df2)
我们看看我们的dataframe有哪些column先:
df.columns.values

array(['area', 'banks', 'buy_ratio', 'category', 'date', 'draw_prob',
       'eipo', 'firstday_performance', 'hk_portion', 'ipo_price',
       'ipo_price_range', 'market_type', 'name', 'now_price', 'one_hand',
       'predict_profile_market_ratio', 'predict_profit_ratio',
       'profit_ratio', 'recommender', 'sales', 'shares_per_hand',
       'stock_type', 'total_performance', 'total_value', 'website'], dtype=object)
我们的目标,也就是我们要预测的值,是首日升幅,即firstday_performance. 我们需要扔掉一些无关的项目,比如日期、收票银行、网址、当前的股价等等。还要扔掉那些没有公开发售的全配售的股票,因为这些股票没有任何散户参与,跟我们目标无关。
# Drop unrelated columns
to_del = ['date', 'banks', 'eipo', 'name', 'now_price', 'website', 'total_performance','predict_profile_market_ratio', 'predict_profit_ratio', 'profit_ratio']
for item in to_del:
    del df[item]

#Drop non_public ipo stocks
df = df[df.draw_prob.notnull()]
对于百分比的数据,我们要换成float的形式:
def per2float(x):
    if not pd.isnull(x):
        x = x.strip('%')
        return float(x)/100.
    else:
        return x

#Format percentage
df['draw_prob'] = df['draw_prob'].apply(per2float)
df['firstday_performance'] = df['firstday_performance'].apply(per2float)
df['hk_portion'] = df['hk_portion'].apply(per2float)
对于”认购不足”的情况,我们要把超购数替换成为0:
def buy_ratio_process(x):
    if x == '認購不足':
        return 0.0
    else:
        return float(x)

#Format buy_ratio
df['buy_ratio'] = df['buy_ratio'].apply(buy_ratio_process)
新股招股的IPO价格是一个区间。有一些新股,招股价上下界拉得很开。因为我们已经有了股价作为另一个,所以我们这里希望能拿到IPO招股价格的上下界范围与招股价相比的一个比例,作为一个新的特征:
def get_low_bound(x):
    if ',' in str(x):
        x = x.replace(',', '')
    try:
        if pd.isnull(x) or '-' not in x:
            return float(x)
        else:
            x = x.split('-')
            return float(x[0])
    except Exception as e:
        print e
        print x

def get_up_bound(x):
    if ',' in str(x):
        x = x.replace(',', '')
    try:
        if pd.isnull(x) or '-' not in x:
            return float(x)
        else:
            x = x.split('-')
            return float(x[1])
    except Exception as e:
        print e
        print x

def get_ipo_range_prop(x):
    if pd.isnull(x):
        return x
    low_bound = get_low_bound(x)
    up_bound = get_up_bound(x)
    return (up_bound-low_bound)*2/(up_bound+low_bound)

#Merge ipo_price_range to proportion of middle
df['ipo_price_range_ratio'] = df['ipo_price_range'].apply(get_ipo_range_prop)
del df['ipo_price_range']
我们取新股招股价对应总市值的中位数作为另一个特征。因为总市值的绝对值是一个非常大的数字,我们把它按比例缩小,使它的取值和其它特征在一个差不多的范围里。
def get_total_value_mid(x):
    if pd.isnull(x):
        return x
    low_bound = get_low_bound(x)
    up_bound = get_up_bound(x)
    return (up_bound+low_bound)/2

df['total_value_mid'] = df['total_value'].apply(get_total_value_mid)/1000000000.
del df['total_value']
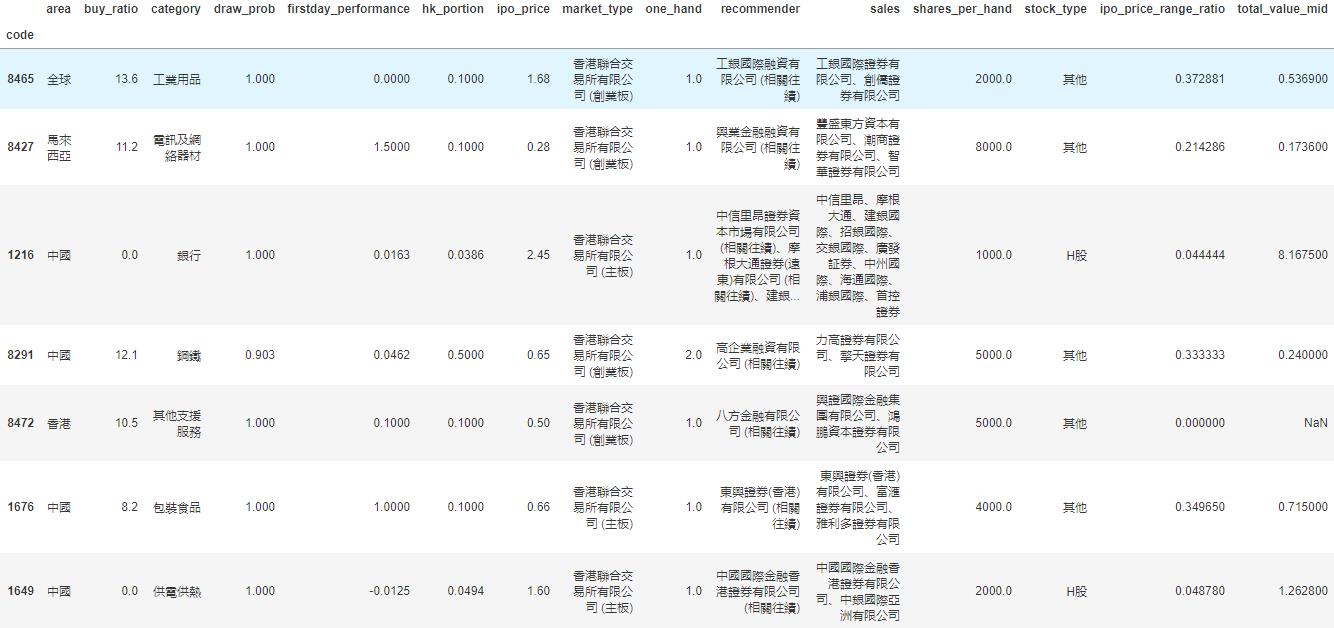
于是我们的数据变成了这样一个278 rows × 15 columns的dataframe,即我们有278个数据点和15个特征:
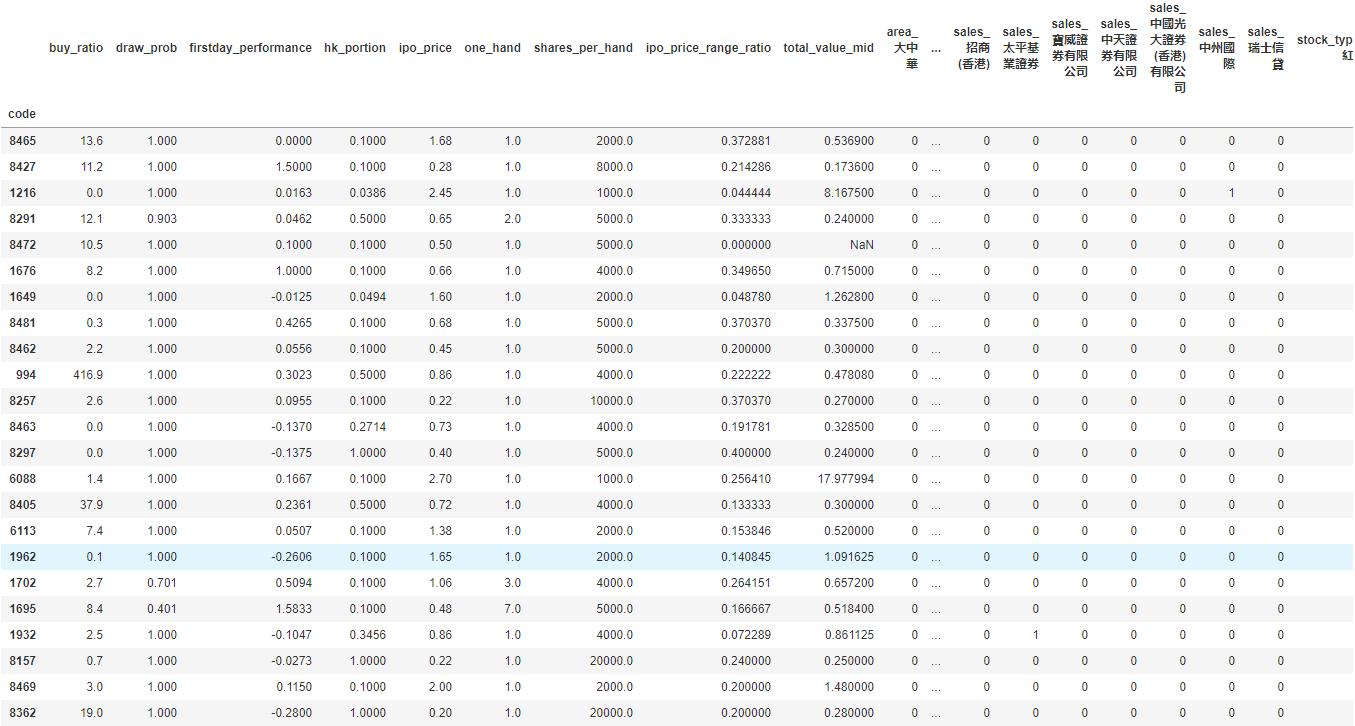
我们看到诸如地区、业务种类等这些特征是categorical的。同时,保荐人和包销商又有多个item的情况。对于这种特征的处理,我们使用one-hot encoding,对每一个种类创建一个新的category,然后用0-1来表示instance是否属于这个category。
#Now do one-hot encoding for all categorical columns
#One problem is that we have to split('、') first for contents with multiple companies

dftest = df.copy()

def one_hot_encoding(df, column_name):
#Reads a df and target column, does tailored one-hot encoding, and return new df for merge

    cat_list = df[column_name].unique().tolist()
    cat_set = set()
    for items in cat_list:
        if pd.isnull(items):
            continue
        items = items.split('、')
        for item in items:
            item = item.strip()
            cat_set.add(item)
    for item in cat_set:
        item = column_name + '_' + item
        df[item] = 0

    def check_onehot(x, cat):
        if pd.isnull(x):
            return 0
        x = x.split('、')
        for item in x:
            if cat == item.strip():
                return 1
        return 0

    for item in cat_set:
        df[column_name + '_' + item] = df[column_name].apply(check_onehot, args=(item, ))

    del df[column_name]
    return df

dftest = one_hot_encoding(dftest, 'area')
dftest = one_hot_encoding(dftest, 'category')
dftest = one_hot_encoding(dftest, 'market_type')
dftest = one_hot_encoding(dftest, 'recommender')
dftest = one_hot_encoding(dftest, 'sales')
dftest = one_hot_encoding(dftest, 'stock_type')
这下我们的数据变成了一个278 rows × 535 columns的dataframe,即我们之前的15个特征因为one-hot encoding,一下子变成了535个特征。这其实是机器学习很常见的一个情况,即我们的数据是一个sparce matrix。
训练模型
有了已经整理好特征的数据,我们可以开始建立机器学习模型了。
这里我们用xgboost为例子建立一个非常简单的模型。xgboost是一个基于boosted tree的模型。大家也可以尝试其它更多的算法模型。
我们把数据读入,然后随机把1/3的股票数据分出来做testing data. 我们这里只是一个示例,更高级的方法可以做诸如n-fold validation,以及grid search寻找最优参数等。
# load data and split feature and label
df = pd.read_csv('../data/hk_ipo_feature_engineered', sep='\t', index_col='code', encoding='utf-8')
Y = df['firstday_performance']
X = df.drop('firstday_performance', axis = 1)
# split data into train and test sets
seed = 7
test_size = 0.33
X_train, X_test, y_train, y_test = train_test_split(X, Y, test_size=test_size, random_state=seed)
# fit model no training data
eval_set = [(X_test, y_test)]
因为新股首日升幅是一个float,所以这是一个regression的问题。我们跑xgboost模型,输出mean squared error (越接近0表明准确率越高):
# fit model no training data
xgb_model = xgb.XGBRegressor().fit(X_train,y_train)
predictions = xgb_model.predict(X_test)
actuals = y_test
print mean_squared_error(actuals, predictions)

0.0643324471123
可见准确率还是蛮高的。
xgboost自带了画出特征重要性的方法xgb.plot_importance。但因为matplotlib配置的一些原因,不能正确显示中文(因为我们的很多feature都是中文的)。所以我直接把feature importance打印出来然后用excel画了。
importance = xgb_model.booster().get_score(importance_type='weight')
tuples = [(k, importance[k]) for k in importance]
outfile = open('feature_importance', 'w')
for item in tuples:
    print >> outfile, item[0].encode('utf-8') + '\t' + str(item[1])
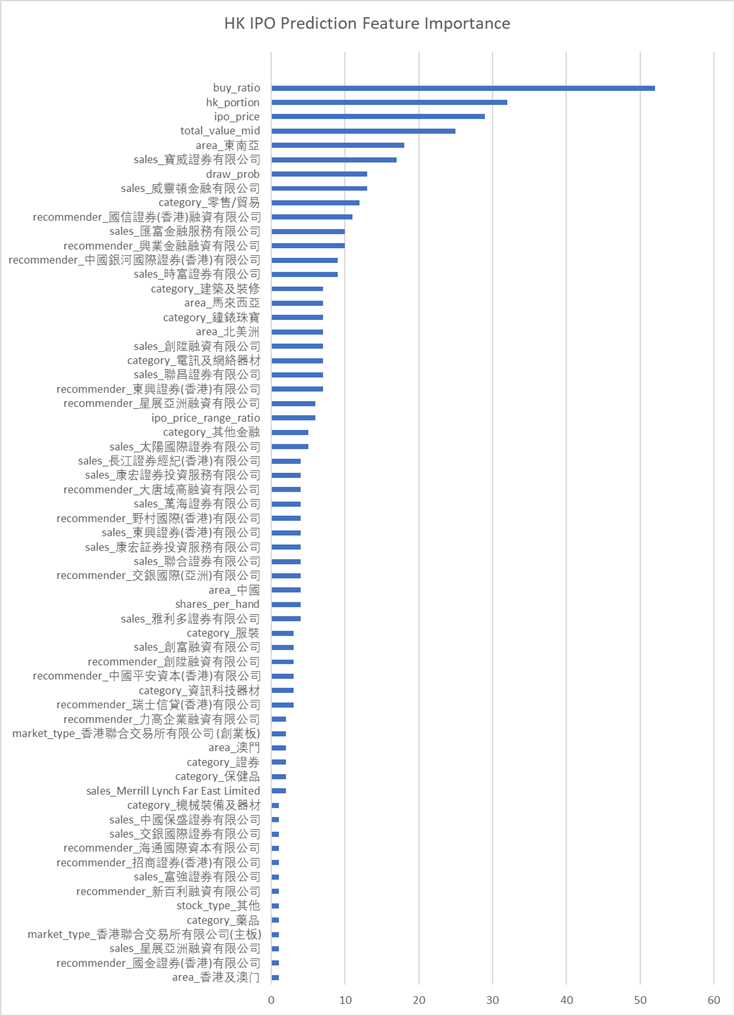
我们看到几个最强的特征,比如超购数、在香港发售的比例、ipo的价格和总市值(细价股更容易涨很多)等。
同时我们还发现了几个比较有意思的特征,比如东南亚地区的股票,和某些包销商与保荐人。
模型预测
这里就略过了。大家大可以自己将即将上市的港股新股做和上面一样的特征处理,然后预测出一个首日升幅,待股票上市后做个对比了!
总结
我们用预测港股新股首日升幅的例子,介绍了一个比较简单的机器学习的流程,包括了数据获取、数据清理、特征处理、模型训练和模型预测等。这其中每一个步骤都可以钻研得非常深;这篇文章只是蜻蜓点水,隔靴搔痒。
最重要的是,掌握了机器学习的知识,也许真的能帮助我们解决很多生活中实际的问题。比如,赚点小钱?